
Measure your usage
Problem
Section titled “Problem”“Copilot feels expensive” is not actionable. You need to know which session, request, or component costs the most.
Actions
Section titled “Actions”- Per request — hover over a chat response to see the credits used by that turn.
- Per session — hover over (or select) the context window control in the chat input. The popover shows total session cost in credits and cumulative context-window token usage.
- Per month — open the Copilot status dashboard from the VS Code status bar to see the percentage of your monthly allowance used, with a link to usage details on GitHub.
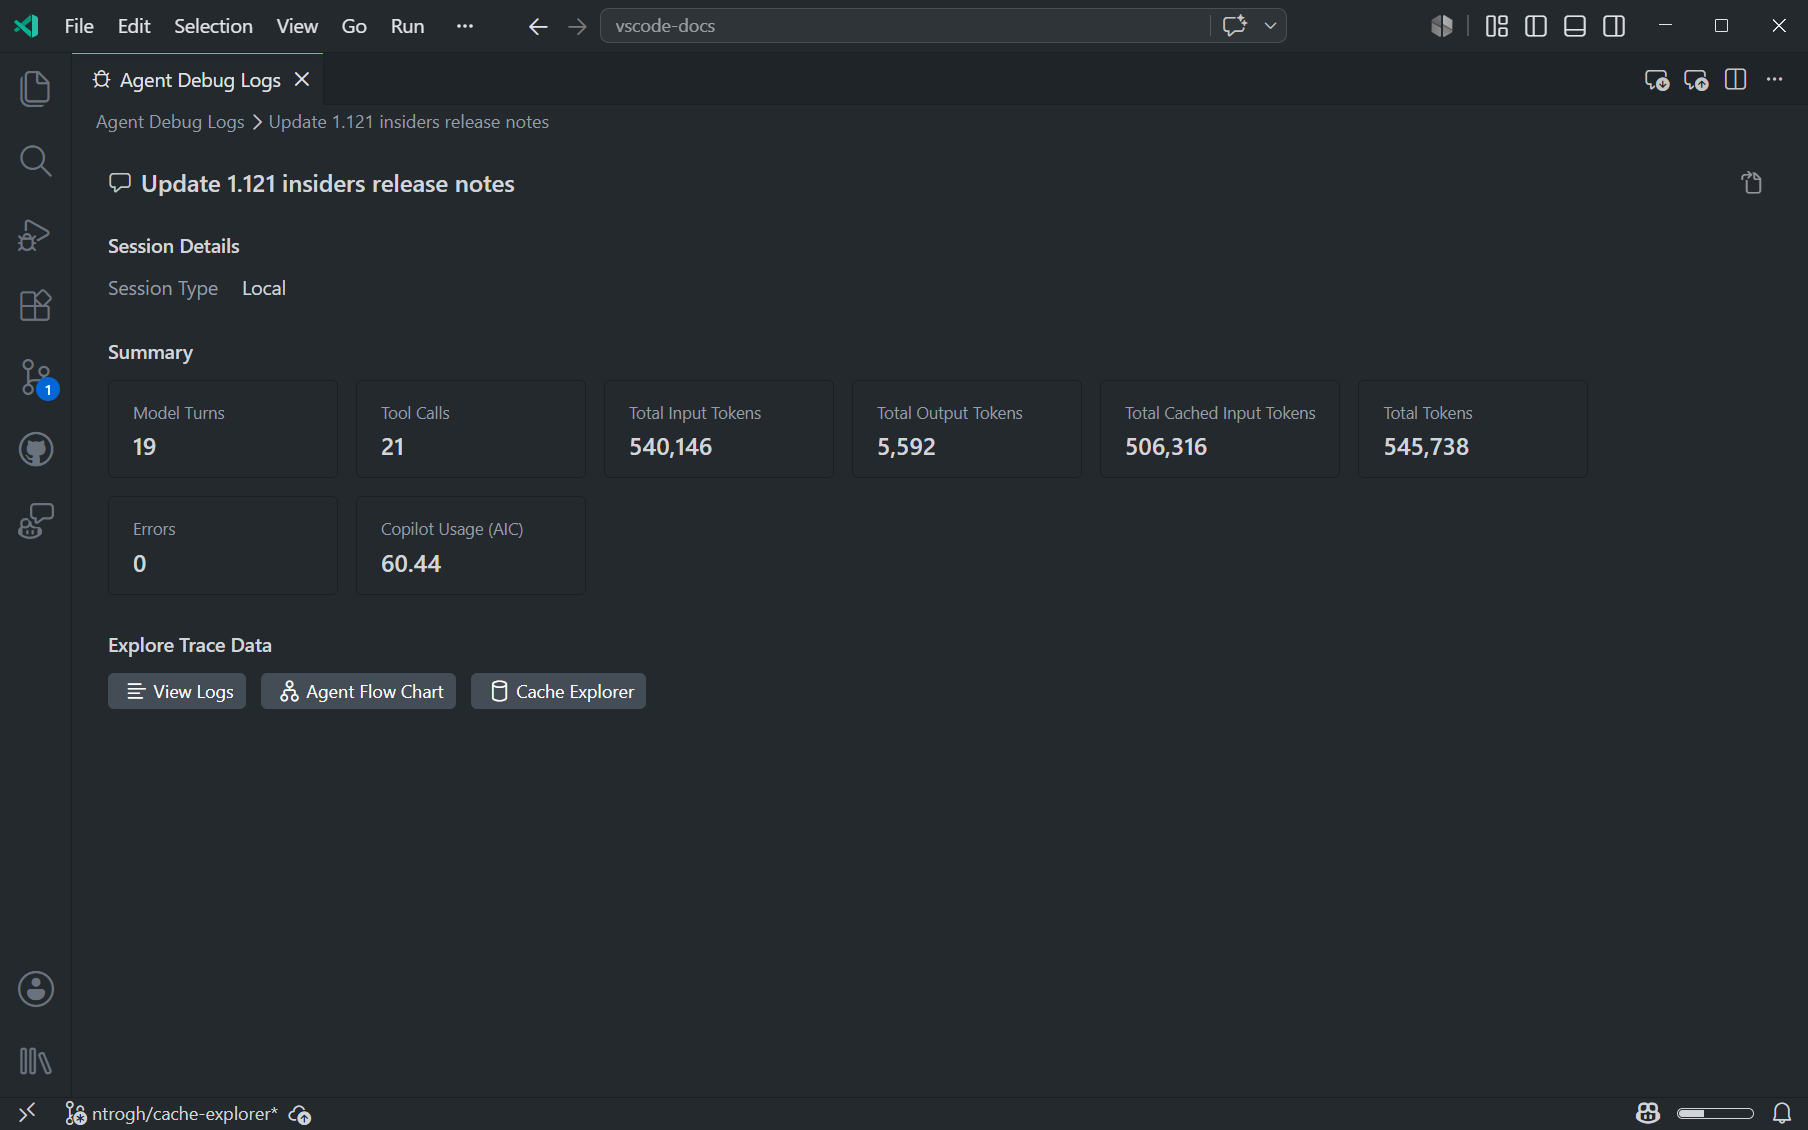
- What is inside a session — open Agent Debug Logs (the
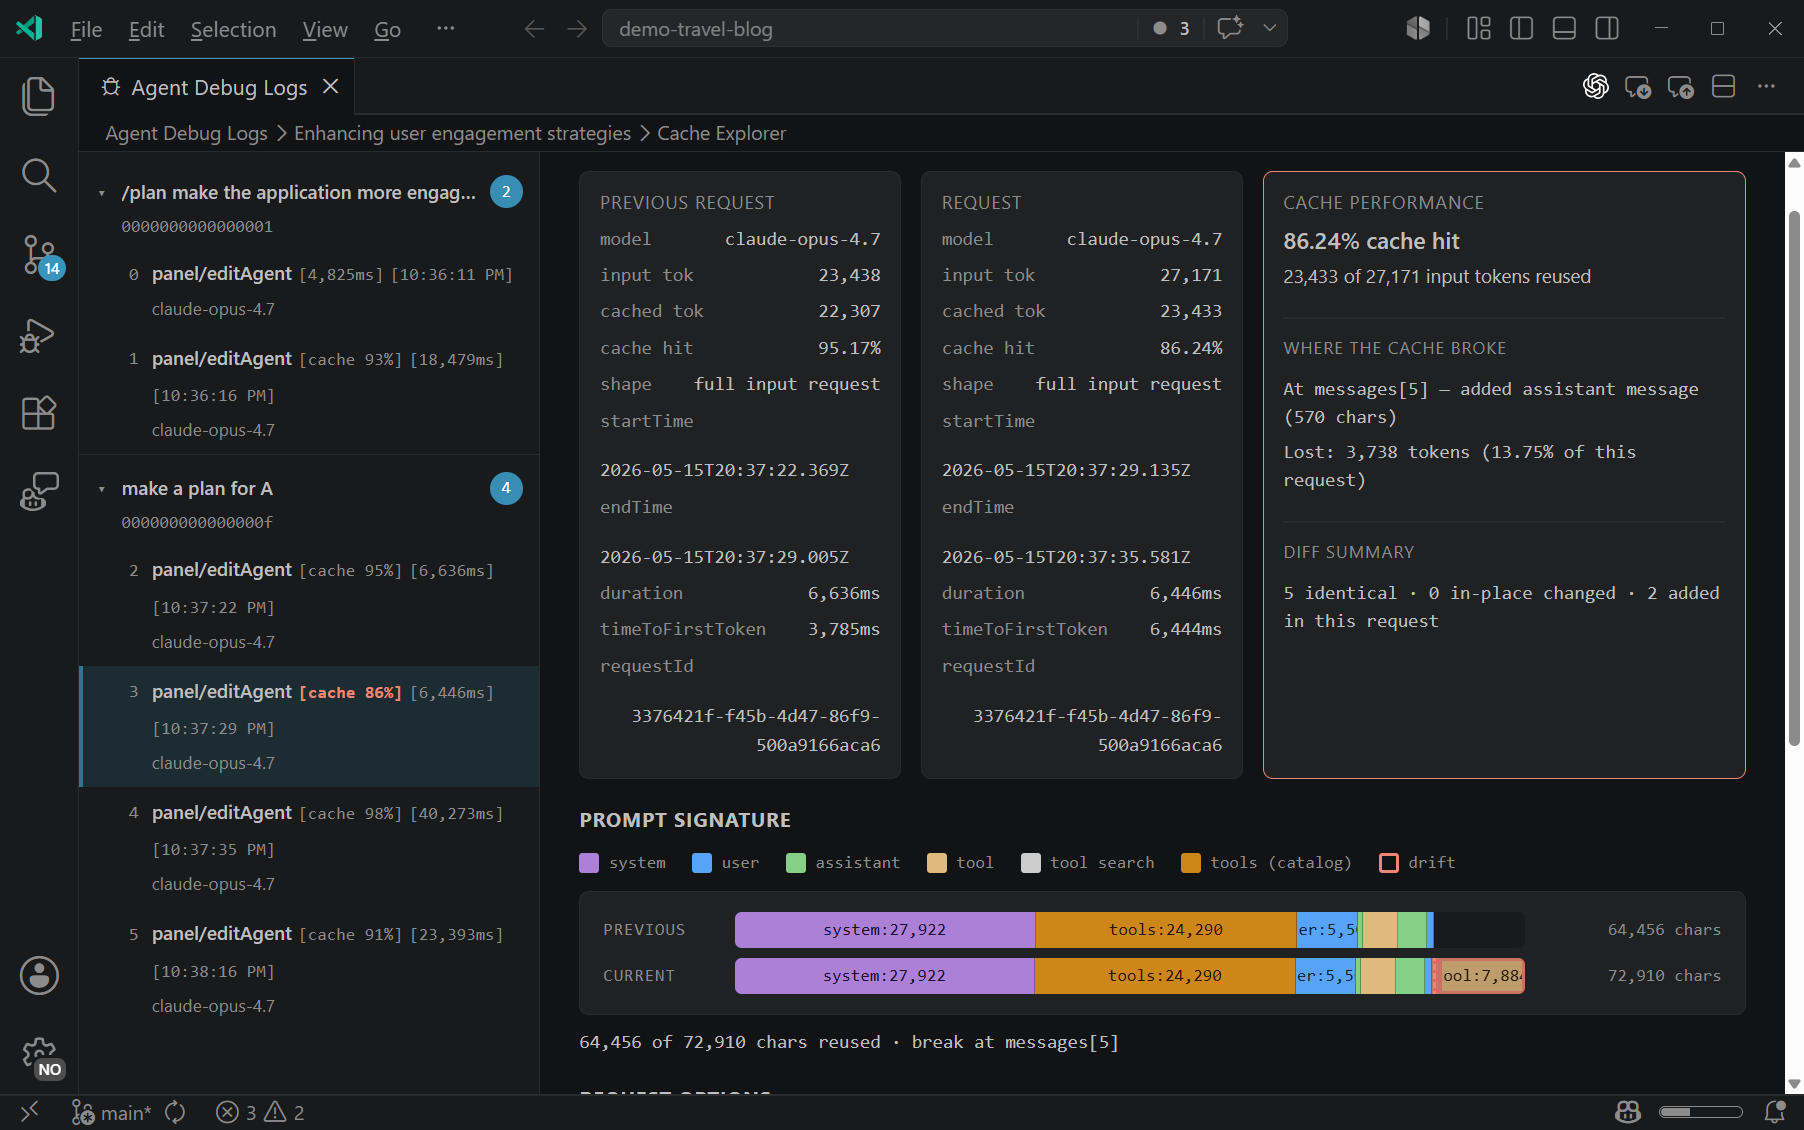
...menu in the Chat view → Show Agent Debug Logs). The Summary view shows aggregate token usage, tool calls, and duration; the Logs view shows individual requests, errors, and tool calls. - Prompt caching — use the Cache Explorer (Agent Debug Logs → Summary → Cache Explorer) when the Summary reports low cache reuse together with unexpected duration or input tokens. It diffs consecutive requests and shows the first divergence in the prompt signature (system instructions, tool definitions, messages).
- Personalized tips — run
/chronicle:cost-tipsin a chat session for recommendations based on your recent activity. This requires a recent VS Code / Copilot Chat build with the Chronicle cost-tips participant enabled. If it is unavailable, use Agent Debug Logs → Summary and Cache Explorer directly. - Model cost — the model picker’s hover shows cost per token type and a Low / Medium / High tier.
- Live retrieval & multi-session savings (
cctx) — if you install the Code Context (cctx) VS Code extension from the Marketplace (dotnetpower.code-context-native), hover over theCCTX Nstatus bar badge or runcctx usage --hours 24in the terminal to see per-model token spend, prompt-cache hit rates, lookup latency, and estimated AIC/USD savings across recent sessions.
How to verify
Section titled “How to verify”Pick one representative task and run it twice with the same model. Record per-request credits, session total, and cache hit %. This is your baseline for every later change.
For a before/after comparison, copy the request or session summary values into your baseline record, or select the session in Agent Debug Logs and use Export to save its OpenTelemetry JSON. Compare the two runs with the same task and model; review exports for sensitive content before sharing.
Trade-offs and cautions
Section titled “Trade-offs and cautions”- The Cache Explorer diff explains a reported cache metric; it does not prove how a provider processed or billed the request. Cache information may be absent for some models.
- Do not remove necessary instructions or tools just to raise cache reuse. Quality comes first.
Further reading (papers)
Section titled “Further reading (papers)”Ordered by venue tier, then citations. Findings are hypotheses to verify on your own workload; see the full list in Papers.
- SGLang: Efficient Execution of Structured Language Model Programs — NeurIPS 2023, 1,783 citations. RadixAttention reuses KV cache across calls that share a prefix; foundation for prefix caching.
- Prompt Cache: Modular Attention Reuse for Low-Latency Inference — MLSys 2023, 417 citations. Reuses precomputed attention states of recurring prompt modules to cut latency.
- Don’t Break the Cache: An Evaluation of Prompt Caching for Long-Horizon Agentic Tasks — preprint 2026, 25 citations. Evaluates prompt caching on long-horizon agentic tasks.