Dashboard
The Dashboard is the landing page of the ElasticBLAST control plane. It is built for operators — the person who keeps the workspace ready so researchers can submit BLAST searches without leaving the browser. Before you open New Search, this page should show every plane (cluster, registry, storage, terminal, sidecars) in a healthy state.
At a glance
The page is divided into four bands, top to bottom:
- Hero header — workspace selector (subscription + Workload RG), auto-refresh interval, Getting Started, Settings.
- Cluster plane — the AKS workload cluster card, full width.
- Resource plane — ACR (registry), Storage (BLAST databases + storage posture), Terminal availability.
- Sidecar runtime — the six in-revision sidecars of
ca-elb-dashboard(frontend, api, worker, beat, redis, terminal).
A small coloured dot to the left of each section label tells you which plane you are looking at. Cards refresh on the cadence picked in the header chip (default: Live — server-pushed updates with a 30 s polling fallback).
Pick a workspace
The hero header drives every card below it.
- Subscription — switches the Azure subscription used by all ARM and data-plane calls. The picker lists every subscription the signed-in account can see; once a subscription has been used it is remembered between sessions.
- Workload RG — the resource group that holds the BLAST workload (AKS cluster, Storage account, optional terminal-related state). The picker is annotated:
- resource groups tagged with
elb-*are listed first; - AKS-managed node resource groups are disabled (you should not deploy into them);
- resource groups with no
elb-*tag are listed asno elb-* tagand disabled until you add the tags via the Setup Wizard.
- resource groups tagged with
- Auto refresh chip —
Live (5 s)/Slow (30 s)/Manual. Live uses the SSE channels under/api/monitor/sidecars/events(and/api/monitor/logs/{container}/eventsfor sidecar logs); Slow uses a 30 s poll; Manual stops automatic refresh until you reload. - Getting Started (reopen icon) — re-opens the checklist panel if you dismissed it.
- Settings (gear icon) — opens the side panel with the current resource configuration, a "Re-run setup wizard" action, and runtime feature flags.
When the Workload RG you select carries the standard tag set, the rest of the configuration (ACR, Storage account, region, terminal hints) is filled in automatically. If the tags are missing, the wizard runs.
First-time setup
The first time you open the dashboard against a fresh subscription, three things can happen:
- One workspace found — the page renders directly with that workspace.
- Multiple workspaces found — the Workspace Picker screen asks you to pick one before any card loads. Each entry shows the resource group name, the region, and the tags that identify the workspace.
- No workspace found — the Setup Wizard runs. It walks through subscription → workload RG → ACR → Storage → optional terminal hints, writes the
elb-*tags onto the chosen RG, and persists the configuration in browser storage. You can re-run it any time from Settings → Re-run setup wizard.
The wizard never provisions Azure resources by itself. It only records the choices so the Dashboard knows where to look; you provision the actual cluster from the Add Cluster action below, and you prepare BLAST databases from the Storage card → Get action.
A persistent Getting Started card sits over the dashboard until every step is green. It checks four things in order: container images in ACR, the AKS workload cluster, the terminal sidecar availability, and at least one prepared BLAST database. Each step links straight to the card that fixes it.
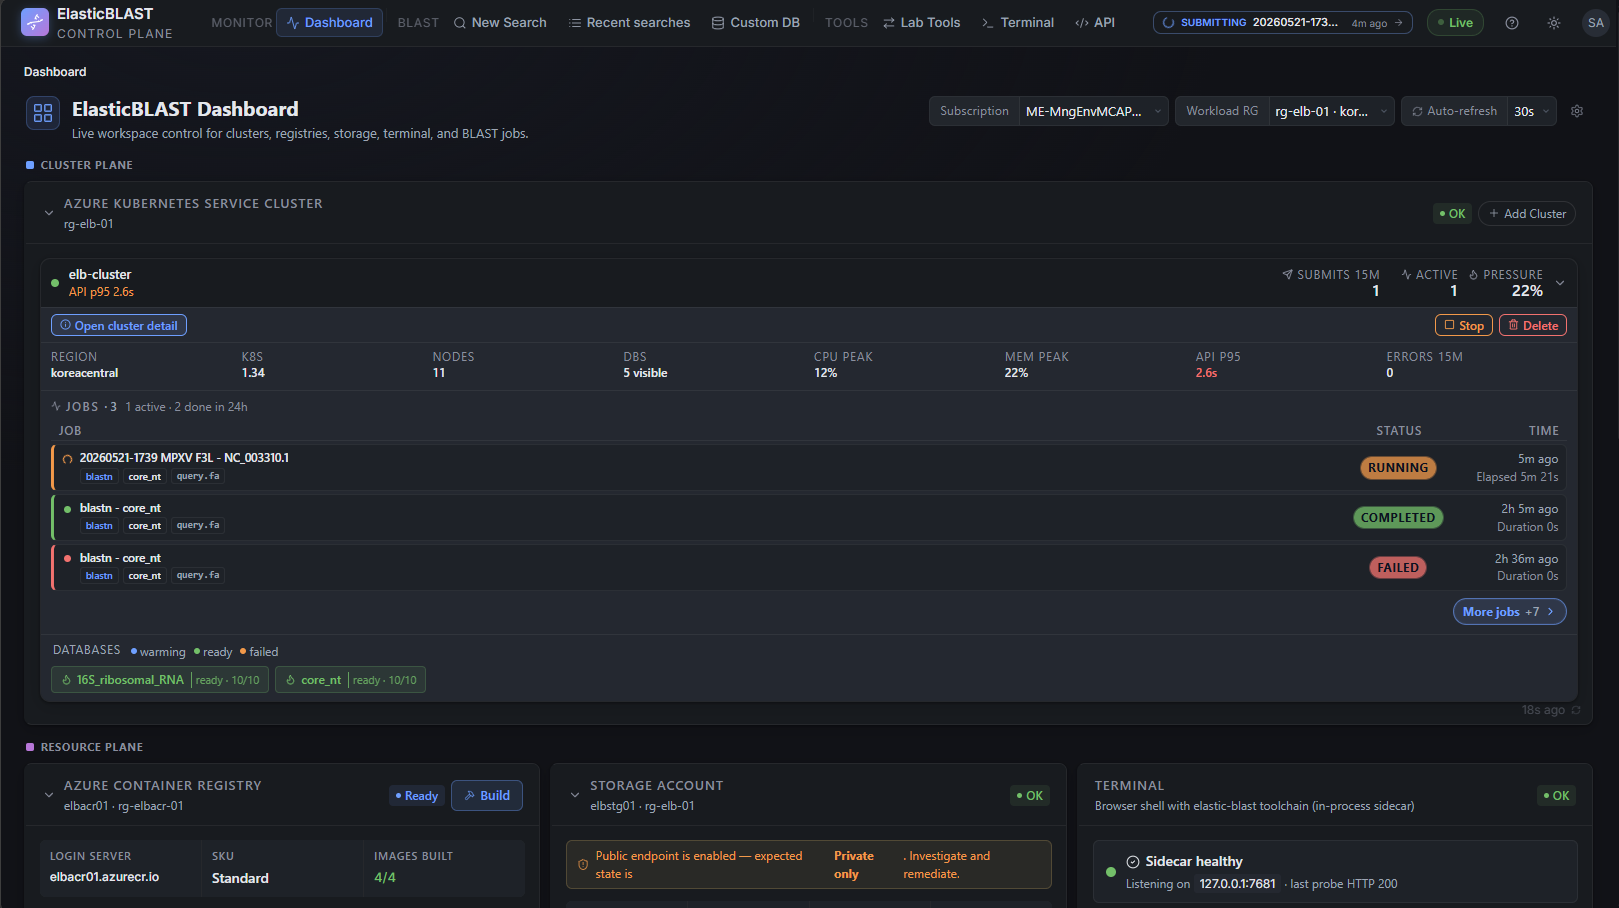
Cluster plane
The Cluster plane section holds a single full-width card backed by the AKS workload cluster. It shows:
- Cluster name and state —
Running,Stopped,Provisioning, orFailed. Stopped clusters can be started from the same card. - Workload node pool — VM SKU, current vs target node count, available vs allocated memory.
- System node pool — small pool that hosts control-plane add-ons.
- Recent activity rail — last few BLAST submissions and their pod-level status (queued, running, completed, failed).
When no suitable cluster exists, the card shows an Add Cluster action. Click it to open the provisioning dialog:
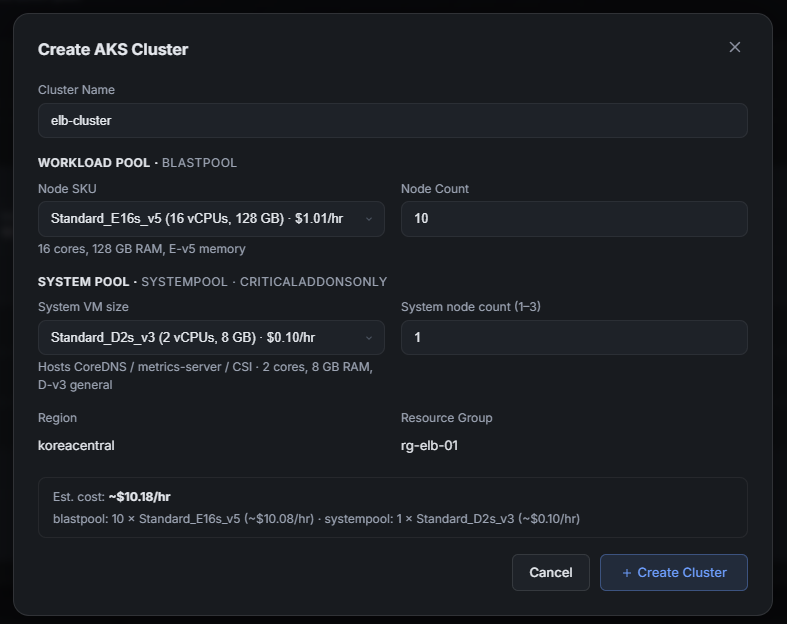
The dialog asks for:
- Workload node size — pick something with enough memory for the largest BLAST database you expect to run (
core_ntandntare memory-bound;nreven more so). - Workload node count — small smoke tests can run on 1 node; production runs scale wider.
- System node pool — a smaller VM hosting add-ons; the default is fine for most workspaces.
- Region and resource group — pre-filled from the workspace selector.
- Estimated hourly cost — based on the SKUs above. The same number is shown on the card after provisioning.
The cluster takes several minutes to provision. The card transitions through Provisioning → Running and the activity rail starts showing pod events once nodes are ready.
Resource plane
The Resource plane section is a three-up grid of ACR, Storage, and Terminal cards.
ACR (Azure Container Registry)
Shows the registry attached to the workspace and the readiness of the BLAST images used by jobs. The card lists each image (the BLAST runtime, the elasticblast-job-submit helper, the elasticblast-query-split helper, and the OpenAPI image), with its build state and last successful tag. When an image is missing, Build All Images runs the ACR Tasks build inside Azure — you don't need a local Docker daemon.
Storage
Shows the workload Storage account and the posture that matters for BLAST work:
publicNetworkAccess— should beDisabledin production. A deployed dashboard always showsDisabled; if it showsEnabledafter debugging, treat it as an incident and runscripts/dev/storage-public-access.sh off.- BLAST databases prepared in this workspace — count, total downloaded size, and a link to the BLAST Databases dialog.
- Auto-warmup state for any database flagged for warm pods.
Click the database icon (or the Prepare DB action from Getting Started) to open the BLAST Databases dialog:
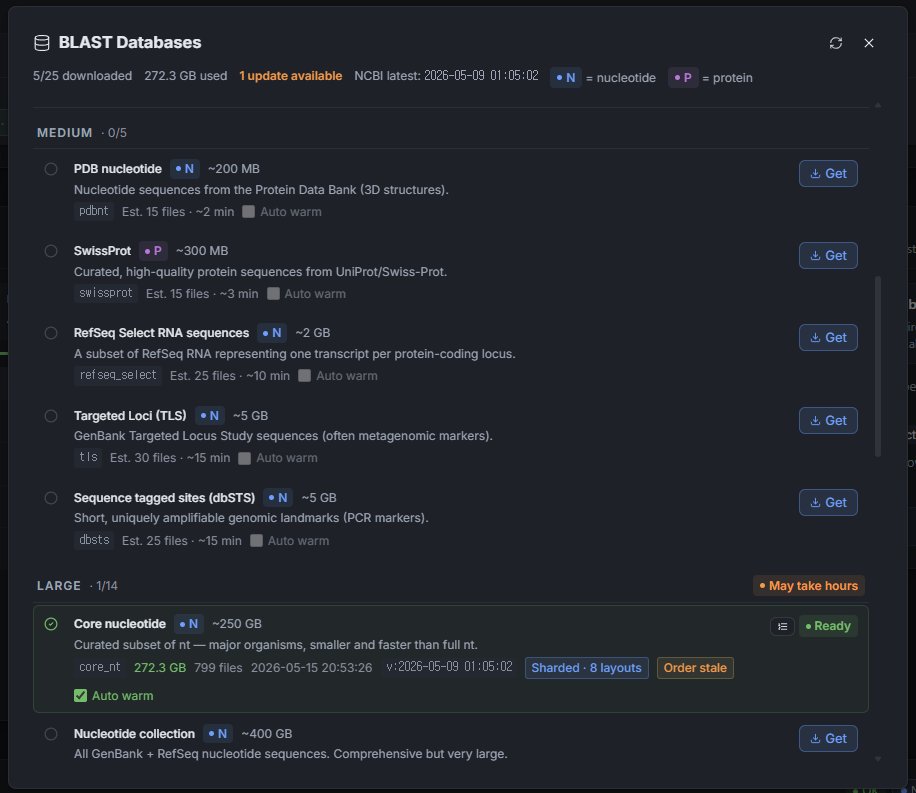
For each NCBI database the dialog shows the upstream size, file count, version time, and a Get button that copies it into the workload Storage account through the terminal sidecar (so it travels over the same private endpoint, never through your laptop). Once prepared, the database panel exposes:
- the shard layout that submit uses to size jobs;
- readiness — a database is "ready" only after the layout has been recorded;
- Auto warm — keeps a small pool of warm pods so the next search avoids cold-start latency.
The database step is not just a download. The Dashboard records metadata and shard layouts so that New Search → Search set can match the database to the cluster you provisioned above.
Terminal
A compact card that reports whether the terminal sidecar is reachable from the api sidecar over the loopback port. When green, the Open Terminal button takes you to Browser Terminal. When red, no shell is available — check Sidecar runtime below for the cause.
Sidecar runtime
The Sidecar runtime band shows the six containers that make up ca-elb-dashboard:
frontend— nginx serving the React bundle on loopback:8081.api— FastAPI / uvicorn on:8080; the only sidecar with public ingress.worker— Celery worker for long-running tasks (BLAST submit, ACR build, AKS work, warmup).beat— Celery scheduler for periodic tasks.redis— the Celery broker, ephemeral (--save '' --appendonly no). The queue is rebuilt from thejobstatetable by the beat reconciler on revision restart.terminal—ttydon loopback:7681plus theelastic-blast,kubectl,azcopy, andaztoolchain.
Each row shows CPU, memory, restart count, and time since last update. Data is pushed from /api/monitor/sidecars/events (SSE) every ~5 s and falls back to a 30 s poll of /api/monitor/sidecars if the SSE stream drops. A degraded row usually means the sidecar is still running but the metrics endpoint is throttled — wait a refresh cycle before treating it as down.
Card states
Every card on the Dashboard renders one of the following states. Understanding them prevents accidental redeploys.
| State | What it means | What to do |
|---|---|---|
| Healthy | Card has data and every signal is green. | Continue. |
| Loading | First fetch in flight; shows a skeleton. | Wait a few seconds. |
| Degraded | Data is fetched but at least one signal is yellow. The card shows a notice with a hint. | Read the hint; degraded usually means an RBAC role is missing, the network posture differs from production, or a Celery task is still running. |
| Unavailable | Card cannot reach the backing Azure resource (404, 403, or network error). | Confirm the resource still exists; confirm the shared user-assigned identity has the right role. |
network_blocked (Storage / BLAST DB only) |
The Dashboard is running locally and Storage publicNetworkAccess is Disabled. The data plane is reachable only from inside the Container App. |
For local debugging, run scripts/dev/local-run.sh storage-on (allowlist your IP), debug, then scripts/dev/local-run.sh storage-off. Never flip Storage open in a deployed environment. |
A degraded card never silently falls back to fake data. If the dashboard cannot get a real answer, it tells you and stops.
Mobile layout
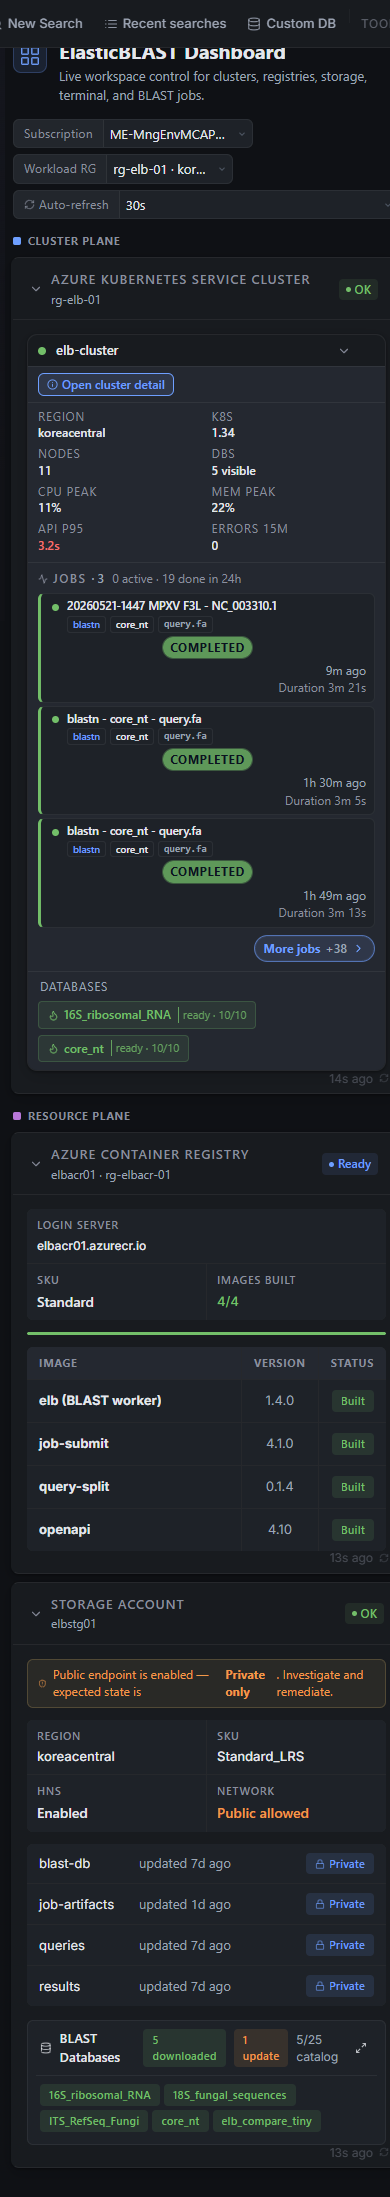
On narrow screens the same cards stack vertically and the Sidecar runtime band is hidden by default (it is admin telemetry, not workflow data). The navigation menu in the top-left opens the full menu: Dashboard, New Search, Recent searches, Custom DB, Lab Tools, Terminal, API.
The Dashboard is the only page that needs a desktop layout for full information density. New Search, Recent searches, and Results are designed mobile-first.
What's next
When every card is healthy:
- Open New Search and submit a small smoke job (e.g.
blastnagainst a preparedcore_ntshard) to verify end to end. - After it finishes, open Recent searches to confirm the list view, then drill into Results to confirm hit data is loading.
- Use Browser Terminal only when you need a CLI — most flows do not require it.