
Benchmarks: 17.22× Warm Retrieval
- How were Code Context performance results measured?
- Code Context benchmarks: 17.22× warm retrieval on the published fixture, token suites, and agent A/B trials. Reproduce the results and read the limitations.
- Scope and evidence
- Local developer tooling, not a hosted source-search service. Benchmark results are workload-specific, not guarantees.
Where can I verify the results and limitations?
Read the benchmark methodology, architecture and privacy boundaries, and technical FAQ.
Code Context publishes paired, correctness-checked retrieval measurements alongside multi-language token-reduction suites and controlled end-to-end coding-agent A/B trials. Every benchmark explicitly states what was measured, what was excluded, and where Code Context is slower.
1. Retrieval latency benchmark (AKS Store Demo, 8,960 pairs)
Section titled “1. Retrieval latency benchmark (AKS Store Demo, 8,960 pairs)”Across 8 fresh daemon sessions × 40 rounds × 28 tasks (8,960 correctness-checked off/on pairs) on the polyglot AKS Store Demo corpus (68 files, 172,244 B across Go, Rust, JavaScript, Vue, TypeScript, and Python; pinned revision 3c3ba3bd999d0b2d78eece1adac84b712b7d9c4f):
- Mixed suite mean:
3.996 mswithout CCTX →0.232 mswith warm CCTX (17.22×faster, 95% session-bootstrap CI17.04–17.40×,94.2%less retrieval wall time; up from6.83×/0.557 msin v0.14). - Mixed suite p95:
6.334 msoff →0.355 mson. - Cold sync median:
19.735 ms(down from98.813 msin v0.14 —5.01×faster).
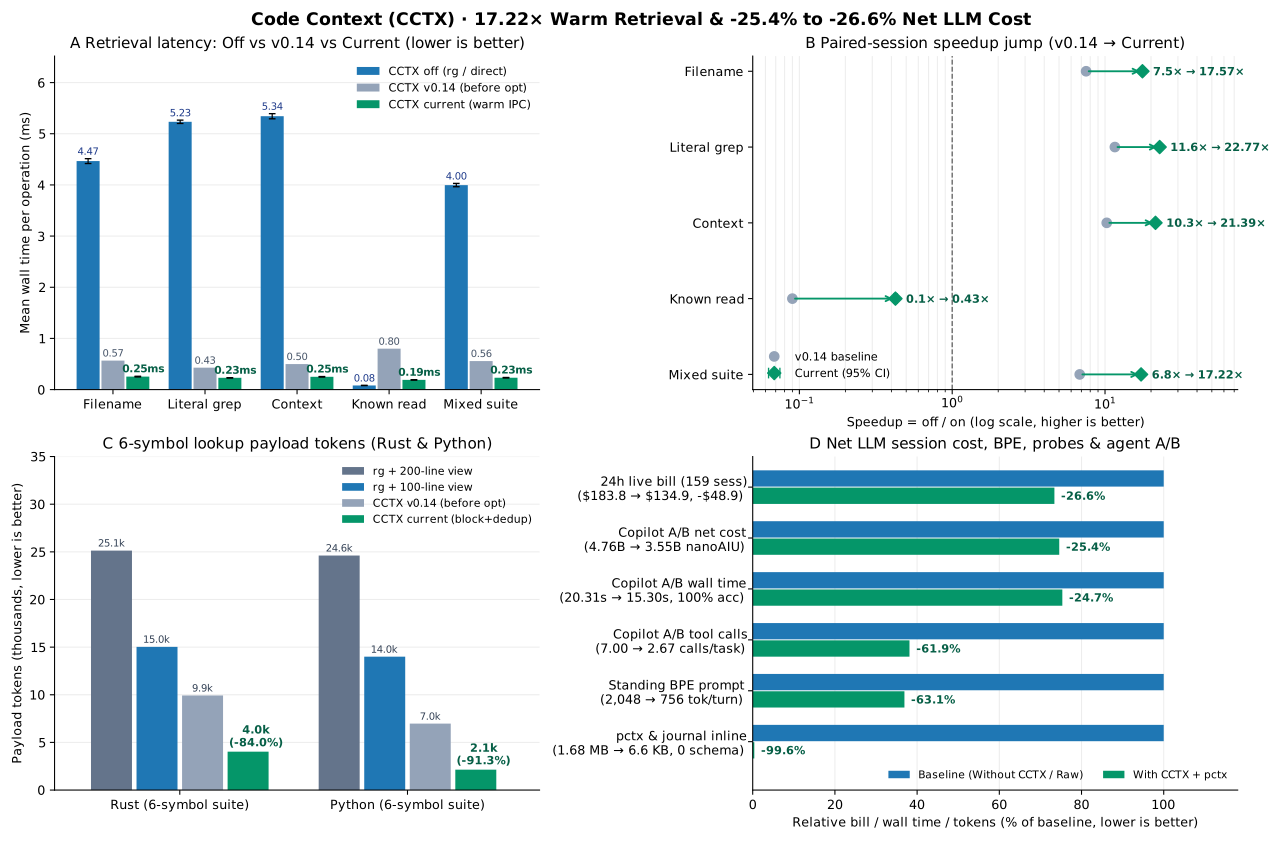
Figure 1. Paired-session retrieval latency, log-scale speedup ratios (dashed parity = 1.0×), lookup token savings, and Copilot CLI A/B trials.
| Retrieval Task | Checked Pairs | CCTX Off Mean | CCTX On Mean (Warm) | Speedup [95% CI] |
|---|---|---|---|---|
Filename discovery (code_files) |
1,920 | 4.466 ms | 0.254 ms | 17.57× [17.29, 17.89] |
Literal search (code_grep) |
2,560 | 5.234 ms | 0.230 ms | 22.77× [22.52, 23.07] |
Search + context (code_context) |
2,560 | 5.343 ms | 0.250 ms | 21.39× [21.18, 21.61] |
Known small read + SHA-256 (code_read) |
1,920 | 0.081 ms | 0.190 ms | 0.425× [0.415, 0.438] — slower |
| Fixed mixed suite (all tasks) | 8,960 | 3.996 ms | 0.232 ms | 17.22× [17.04, 17.40] |
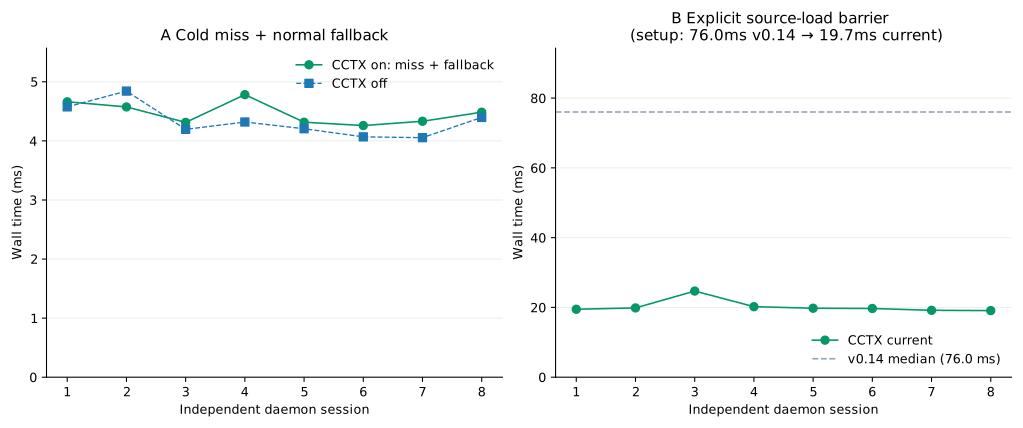
Figure 2. Descriptive cold-control lookup, nonblocking CACHE_MISS + fallback, and explicit cold synchronization (19.735 ms median).
2. Lookup payload token suites (Rust & Python)
Section titled “2. Lookup payload token suites (Rust & Python)”Replacing traditional two-step rg -n + 100-line or 200-line view reads with a single AST block-clamped code_context call (radius=8..12, max_matches_per_file=5 with definition priority):
| Corpus & 6-Symbol Suite | Tool Calls (rg+view → cctx) |
rg + 200L view |
rg + 100L view |
cctx code_context |
Payload Token Reduction | Retrieval Time |
|---|---|---|---|---|---|---|
Rust (src/, 20 files) |
20 → 6 (-70.0%) | 25,133 tok | 15,028 tok | 4,031 tok | -73.2% to -84.0% | 26.24 ms → 2.56 ms (10.3×) |
| Python (506 files, 17.3k lines) | 15 → 6 (-60.0%) | 24,609 tok | 13,997 tok | 2,141 tok | -84.7% to -91.3% | 5.33 ms → 0.40 ms (13.16×) |
3. End-to-end Copilot CLI agent A/B trials
Section titled “3. End-to-end Copilot CLI agent A/B trials”Measured with scripts/agent_ab.py on a 6,000-file Rust workspace across identical multi-file questions, identical model configuration, alternating trial order, and 100% answer accuracy in both arms:
| Metric (Mean per Trial) | Baseline (rg / glob / view) |
With cctx (code_context) |
Measured Delta |
|---|---|---|---|
| Tool invocations | 7.00 | 2.67 | -61.9% tool calls |
| LLM round-trip turns | 5.00 | 3.67 | -26.7% turns |
| Tool result payload tokens | 6,360 tok | 3,177 tok | -50.0% payload tokens |
Total session billing (totalNanoAiu) |
4.76B nanoAIU | 3.55B nanoAIU | -25.4% net AIU cost |
| End-to-end completion wall time | 20.31 s | 15.30 s | -24.7% faster |
4. Rich documents, pctx probes & cctx journal
Section titled “4. Rich documents, pctx probes & cctx journal”| Workload | Raw Payload | Delivered to Context | Reduction | Median Latency |
|---|---|---|---|---|
Rich documents (.pptx/.docx/.md #toc & #slide-N) |
Full document | Virtual #toc + #slide-N-M |
-86.3% to -98.9% | 5.4× faster DEFLATE |
pctx json (5,000 API records, --where + --count-by) |
1,021,281 B | 662 B | -99.94% | 7.82 ms |
pctx batch (2,400-line log, 2 RRF queries + digest) |
226,918 B | 4,079 B | -98.20% | 21.81 ms |
pctx log @latest (follow-up BM25 + Trigram RRF) |
226,918 B | 2,273 B | -99.00% | 11.00 ms (0 re-exec) |
cctx journal resume (40-step session state) |
434,271 B | 1,829 B (<=2 KiB) |
-99.58% | 5.51 ms |
BPE-aligned formula instructions (cctx prompt) |
2,048 tok | 756 tok | -63.1% | Static / per-turn |
5. Net LLM cost analysis (24h production trace replay)
Section titled “5. Net LLM cost analysis (24h production trace replay)”Shrinking a single tool output by 99% via large MCP tool catalogs or PreToolUse hook denials often increases total session billing because model output tokens and extra uncached turns cost 10× to 100× more than cached history reads.
Replaying 159 live multi-model coding sessions (7,578 turns, 2.86B total tokens, 95.5% warm cache hit rate, 90.3% eligible source adoption) via cctx usage --hours 24 --details models $48.88 USD (-26.6%) lower spend (~$183.78 → $134.90 @ $0.001/AIC; ~$488.82 @ $0.01 API list reference):
Savings Driver (cctx usage --hours 24 --details) |
Tokens Avoided | Share | Why It Lowers the Actual Bill |
|---|---|---|---|
1. Avoided LLM round-trip turns (~2,290 turns) |
851.76M tok | 54.0% | Combining search + block-clamped read in 1 turn eliminates extra model invocations, reasoning/output tokens, and full-history re-submissions. |
2. Compounded prompt-cache re-reads (98.7× mult.) |
701.82M tok | 44.5% | Keeping noisy lines out on turn k avoids re-reading those tokens across turns k+1 … T before compaction. |
3. Standing BPE formula compression (4/4 surfaces) |
16.09M tok | 1.0% | Saves ~2,123 tok on every turn (0 extra MCP schemas for pctx & journal). |
| 4. First-turn tool payload byte delta | 7.11M tok | 0.5% | Immediate single-call byte trimming alone is <0.5% of total session token exposure. |
| Total modeled 24h impact | ~1.58B tok | 100.0% | ~$183.78 → $134.90 (-$48.88 USD / -26.6% @ $0.001/AIC) |
6. Reproduce on your own machine
Section titled “6. Reproduce on your own machine”git clone https://github.com/dotnetpower/code-context.gitcd code-contextgit clone https://github.com/dotnetpower/aks-store-demo.git ../aks-store-demogit -C ../aks-store-demo checkout 3c3ba3bd999d0b2d78eece1adac84b712b7d9c4f
cargo build --locked --releasepython3 -m venv .venv-benchmark.venv-benchmark/bin/pip install -r benchmarks/requirements.txt.venv-benchmark/bin/python benchmarks/benchmark.py \ --root ../aks-store-demo --cctx target/release/cctx \ --sessions 8 --rounds 40 --seed 20261023 \ --output /tmp/cctx-benchmark-runRaw observations and summary CSVs are published in the repository under benchmarks/results/aks-store-demo/.